Marin Real Estate Market Continues To Be HOT!
The real estate market in Marin continues to be hot. REALLY hot, as hot as it has been since the big recovery after the big recession in 2008-2010.
I don’t think anyone expected this as an outcome of the Covid-19 crisis, but here we are. As noted last month, three big factors are driving this:
1. Interest rates are low, as low as I have seen them. I know mortgage officers doing 30-year fixed conventional loans at 3% right now. No, that is not a typo. 3%. Period.
2. The spring market push got moved back . The big push of buyers that happens every year in March-June got pushed back two months, because it was almost impossible to show property. So it is happening now.
3. Lots of people who were thinking about leaving the City are saying “I want to move now”, and Marin County, which has the lowest population and highest percentage of open space of any Bay Area County is a primary destination.
We always look at percentage of homes in contract, and they are as high as they have been in several years. For homes under $1 Million, 45% of the 257 available are already in contract.
For the $1 Million -$2 Million range, 56% of the 320 homes are in contract, which is very high as well. We consider over 40% a Sellers Market, so we are well in that range.
And in the over $2 Million market, 28% of the homes are in contract, which is the highest it has been all year. Probably in a few years!
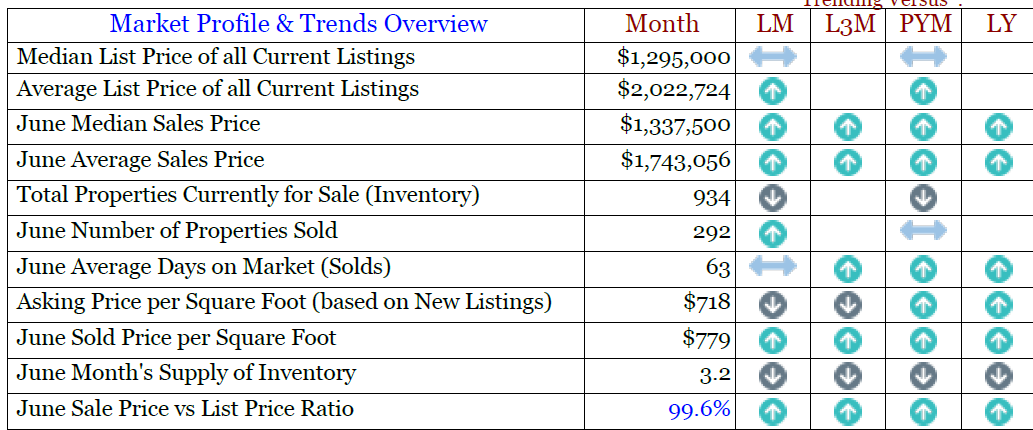
The chart below has a lot of data that will show you how all of the numbers are trending. The first thing to note is most of the arrows are going up! Except for inventory, which is down vs. YTD numbers.
The other big takeaway on here is pricing. We had expected pricing to show little if any increase this year, but this shows the June median sales price, $1,337,500, is well above the YTD number of $1,212,500. Average sale price is up significantly as well.
One more chart will help illustrate all of this. The price per square foot is a very reliable metric to watch. And it has been going up, and last month, it went up significantly. The chart below shows selling price per square foot since January 2017, and note the curve flattens out a bit in 2018 -2019. But look at the line from January 2020 on, it is going up, and up. This demonstrates pricing, in general, is going up.

We don’t know where all of this is going, but we do right now it is crazy. It is still hard to show houses, everyone needs to get an appointment and sign multiple documents. And everyone must wear masks, the numbers of people are limited, and social distancing is the rule. Listing agents are not allowed in the house if a buyer is there with their agent. There are still no open houses, and no broker tours.
Yet, on our new listing on 103 Twelveoak Hill, we had 63 showings in 8 days, all of which required an appointment, and paperwork. And we received 13 offers! And a house in Fairfax, priced at $735,000, 2bd/1ba, received 34 offers. It hasn’t closed yet, but that one went WAY over asking.
It is active, for sure. No one predicted this, and I’m not going to try and predict what happens next either. There are still a lot of unknowns out there. Stay tuned!